Relational Data Modeling
Orders, customers, payments, reviews, products, and order items were connected into a relational reporting model designed to support KPI analysis across multiple business areas.
Portfolio Case Study
Revenue trends, fulfillment reliability, and customer satisfaction all play a major role in e-commerce performance. This dashboard focuses on the metrics most tied to operational visibility, customer behavior, and marketplace growth.
Overview
E-commerce performance depends on more than revenue alone. Order activity, delivery timing, customer reviews, and purchasing behavior all influence how a marketplace performs over time.
This reporting workflow brings those operational and customer metrics into a single dashboard focused on KPI visibility, trend analysis, and day-to-day business reporting.
The reporting structure separates high-level KPI monitoring from deeper operational analysis, making it easier to track performance while still exploring the trends driving those results.
Walkthrough
This project walkthrough shows the dashboard interaction flow, KPI structure, and supporting reporting views used to explore sales, fulfillment, customer behavior, and purchasing patterns across the Olist e-commerce dataset.
Business Problem
The reporting focuses on operational and customer metrics commonly used to evaluate marketplace performance and fulfillment reliability.
Approach
By identifying business questions and focusing on key metrics, the reporting workflow was organized around operational visibility, customer behavior, and revenue performance.
Orders, customers, payments, reviews, products, and order items were connected into a relational reporting model designed to support KPI analysis across multiple business areas.
Revenue growth, order activity, delivery timing, customer reviews, and installment behavior were structured into reporting metrics focused on operational and customer visibility.
Executive KPI reporting was separated from more detailed operational analysis to keep the reporting focused, readable, and easier to navigate.
Power Query workflows and lightweight Python audit scripts were used to validate relationships, identify inconsistent records, and prepare the dataset for reporting.
Main Dashboard
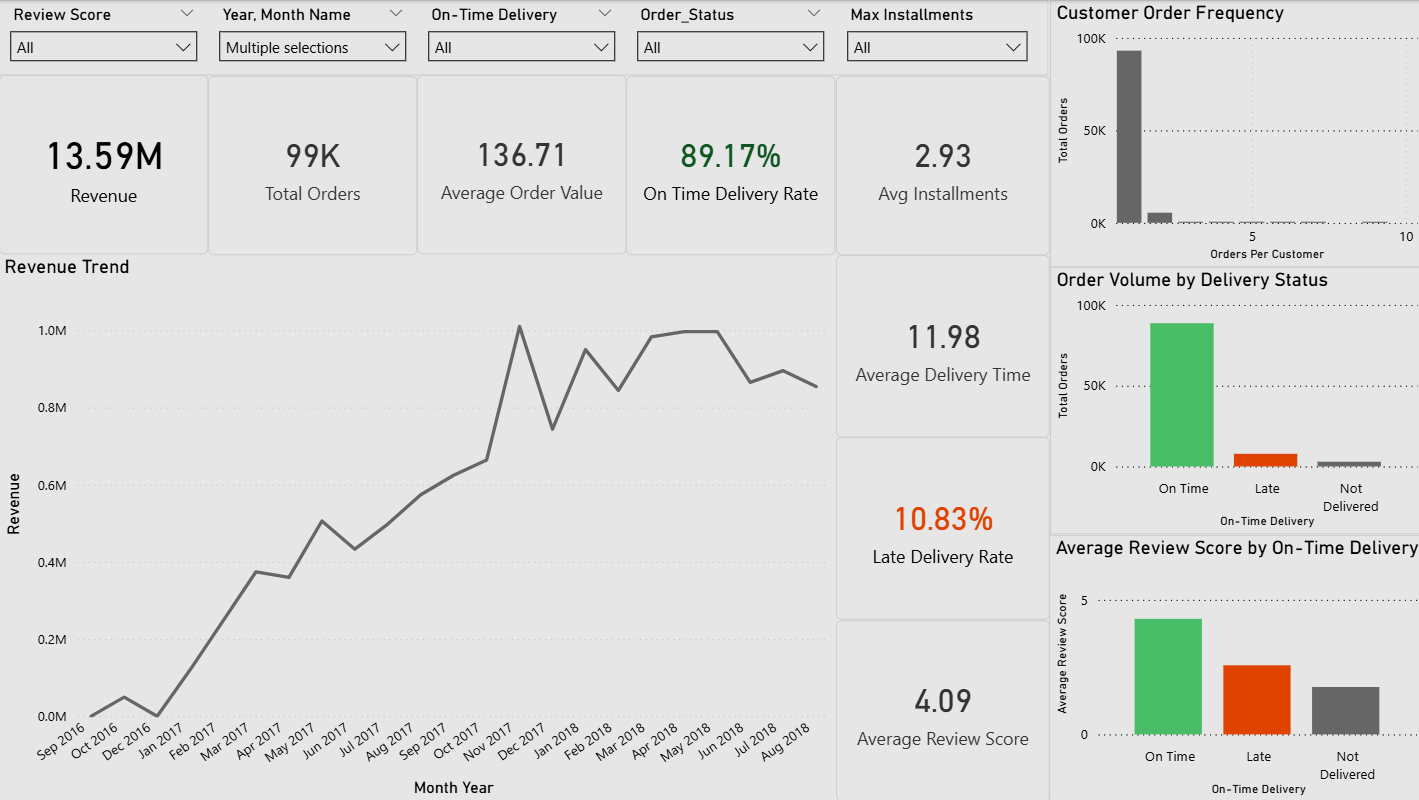
The main reporting view brings revenue performance, fulfillment reliability, customer satisfaction, and purchasing behavior into a single operational snapshot.
Trend Analysis
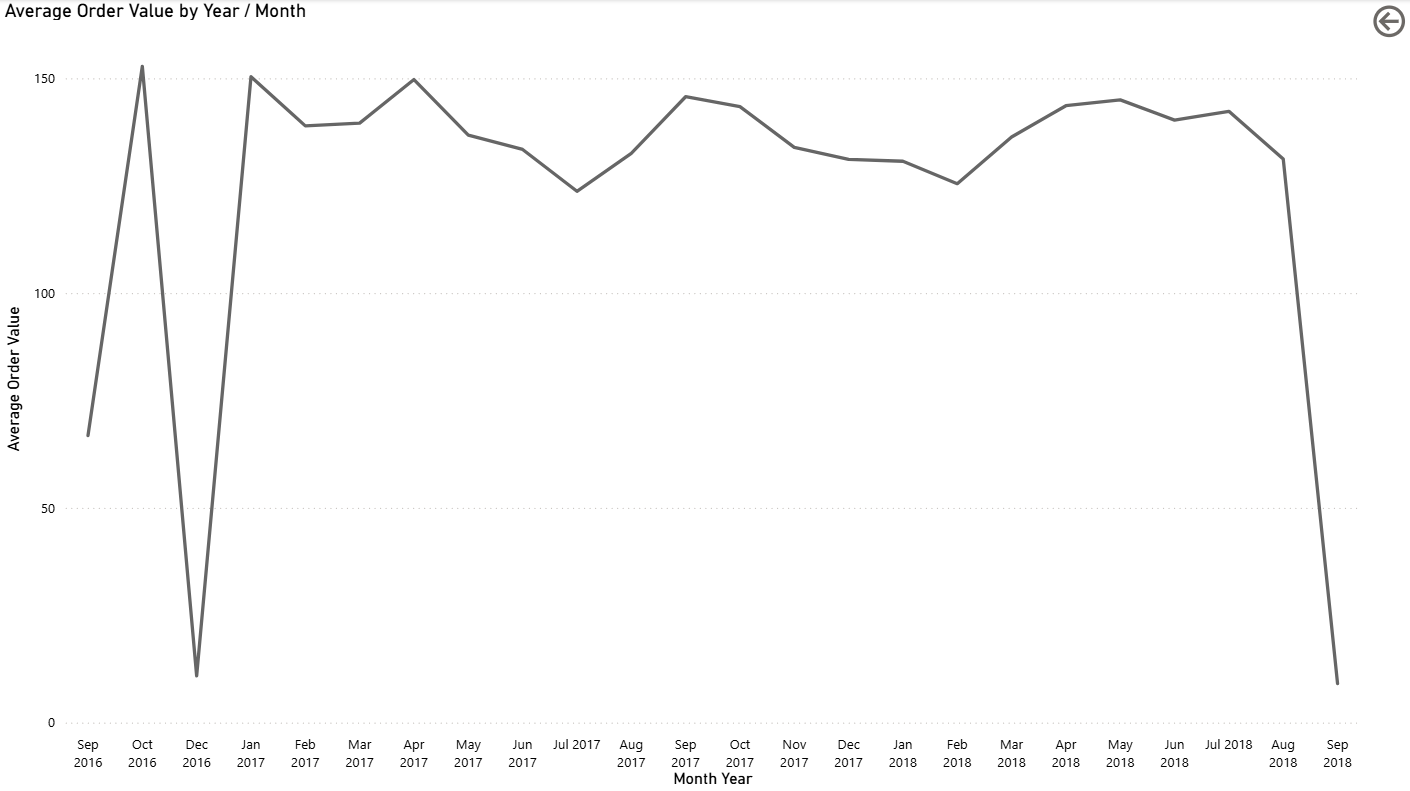
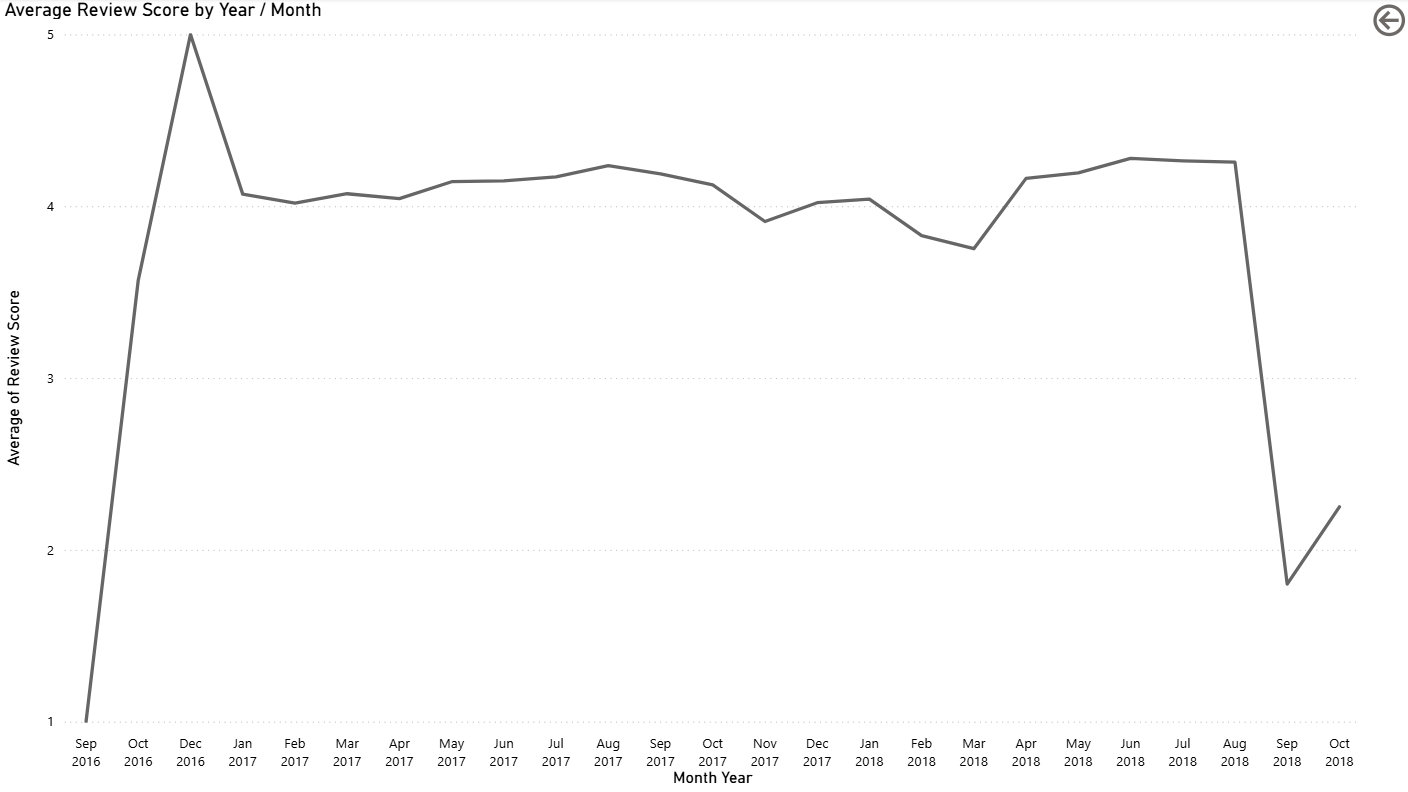
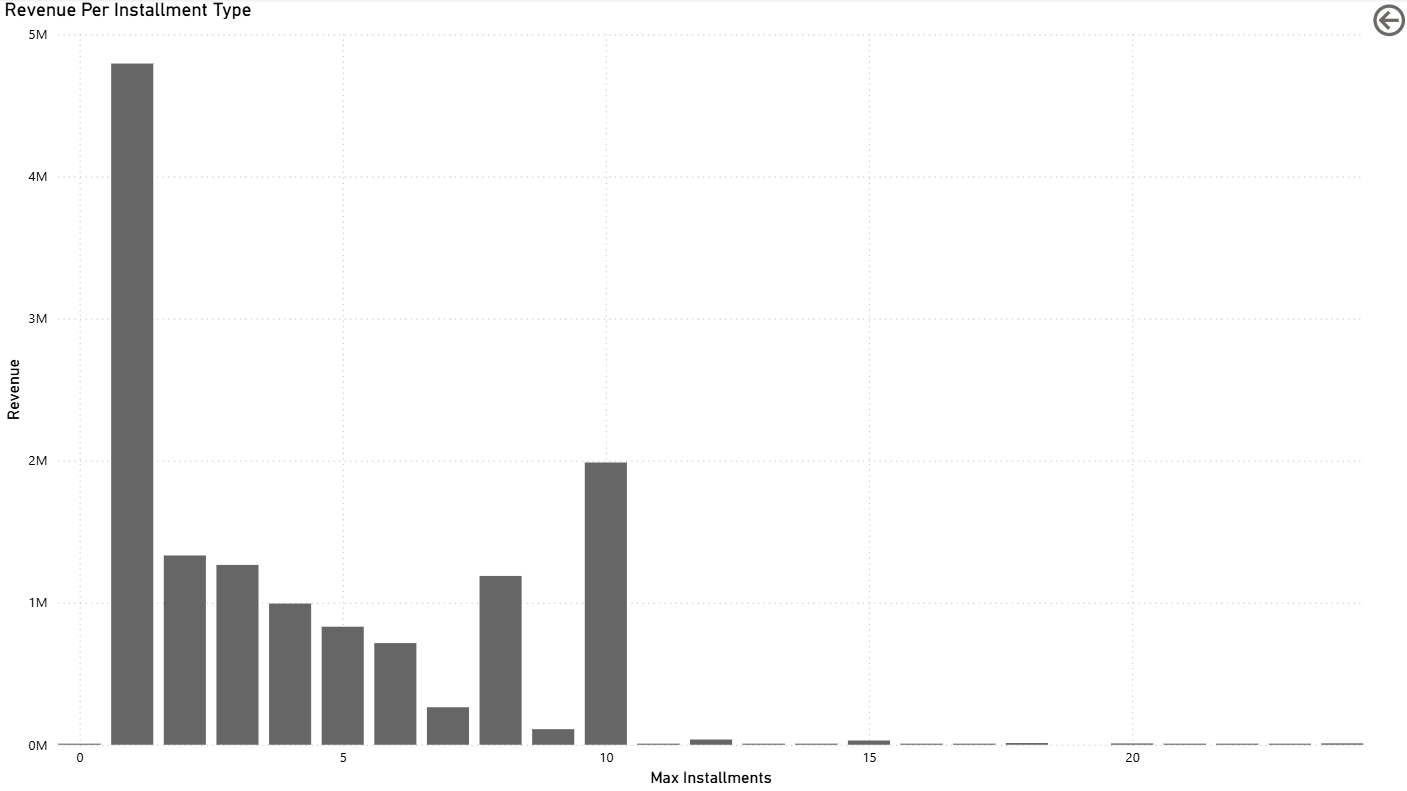
Supporting dashboard views expand on customer behavior, order trends, review activity, and purchasing patterns across the marketplace.
Key Insights
Tools Used
KPI reporting, relational modeling, dashboard structure, interaction flow, and business-focused analytics.
Data preparation, cleanup workflows, transformation logic, and reporting preparation.
Dataset auditing, null analysis, duplicate validation, and preprocessing support.
Outcome
The reporting workflow covers the process from data intake and validation through relational modeling, KPI reporting, dashboard architecture, and operational analysis.
Revenue visibility, delivery performance, customer satisfaction, and purchasing behavior were brought into a single reporting layer designed around day-to-day business visibility.
The final dashboard balances executive KPI reporting with deeper operational and customer trend analysis across multiple areas of the business.